PGV ShakeMaps Derived from Geodetic Measurement
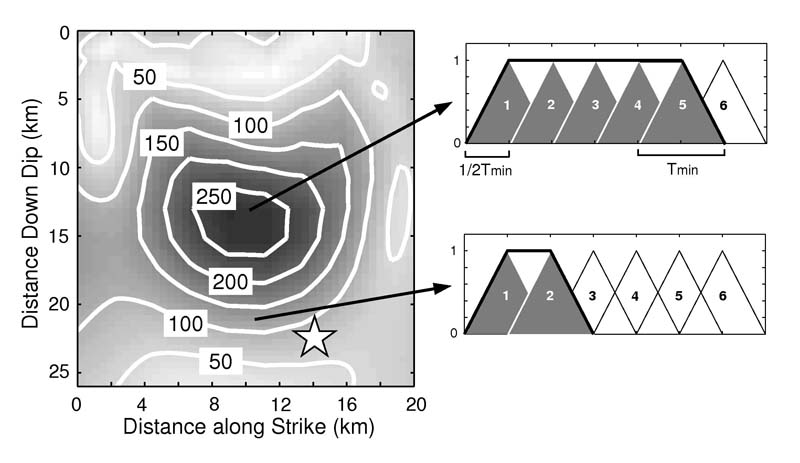
A schematic diagram showing how to determine the number of time windows for a variable-slip model. Left column shows the variable slip model on its rupture plane (Hudnut et al. 1996). White star indicates hypocenter of Northridge event. Two small panels on the right indicate necessary time windows (solid gray triangles) and final rise time curve (thick black) associated with slip patches indicated on slip distribution model.
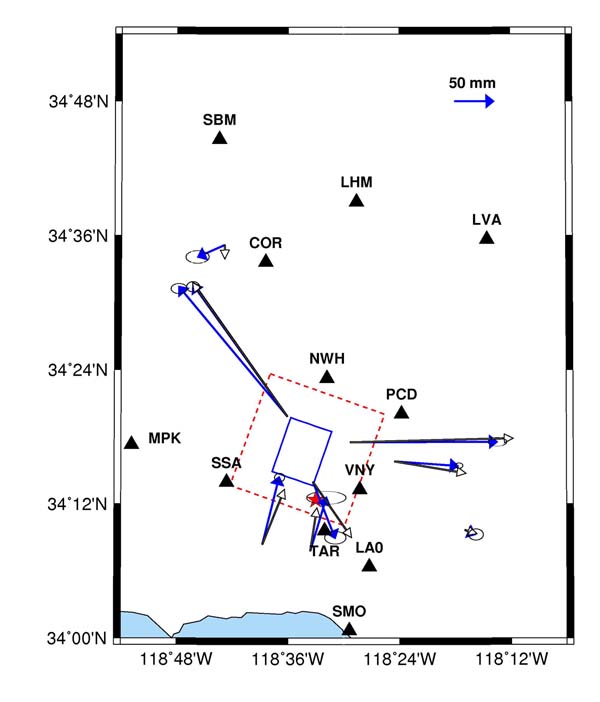
A comparison of observed (blue), with 95% confidence regions, and modeled (white) GPS displacement vectors in the vicinity of the epicenter (red star). Rectangles and surface projection of the finite-fault geometries for the uniform-slip inversion based on 10 GPS displacement (thick solid, Hudnut & Murray, pers. Comm. 1994) and the variable-slip inversion from seismic and geodetic observation (dotted red) (Hudnut et al. 1996). 12 selected stations indicated with black triangles
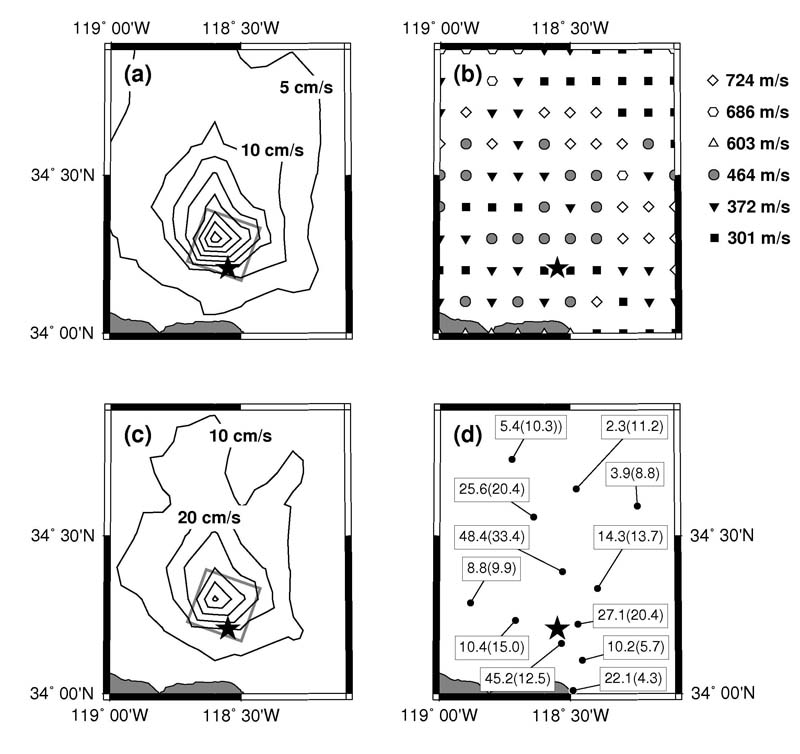
(a) A predicted PGV ShakeMap for model VAR within a slip velocity of 76.8 cm s-1 and rupture velocity of 3.00 km s-1 assumptions. The black star indicates mainshock epicenter. Rectangles are surface projection of model VAR. (b) An average upper 30 meter shear wave velocities at grid points within given region. (c) Same as (a) for after correcting site effects. (d) A comparison of predicted PGV and observed PGV at 12 stations. Figures in box and parenthesis refer to observed and predicted PGV in cm s-1.
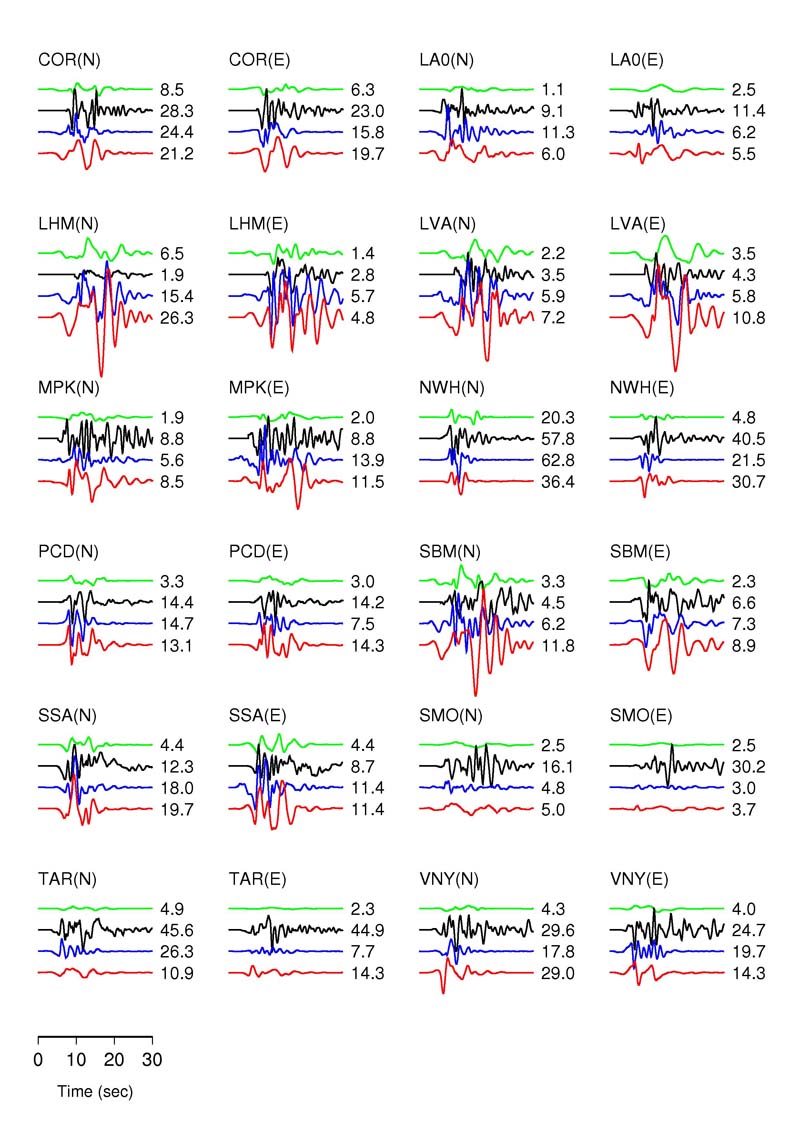
A comparison of two horizontal velocity waveforms at 12 stations (see second figure). Each panel has four waveforms; from the top to bottom, synthetic for model UNI (green), observation (black), synthetic for models REF (blue) and VAR (red). All waveforms are low pass filtered with the corner frequency of 1 Hz and normalized to the maximum amplitude of observed record. Numbers on the right of each waveform indicate maximum velocity of records in cm s-1.
References
Junkee Rhie, Doug Dreger, Mark Murray, and Nicolas Houlié, (2009), Peak ground velocity ShakeMaps derived from geodetic slip models, Geophysical Journal International, 179(2), 1105-1112. [PDF]