A Simple Method for Simulating H/V Spectral Ratio in 3D Structure
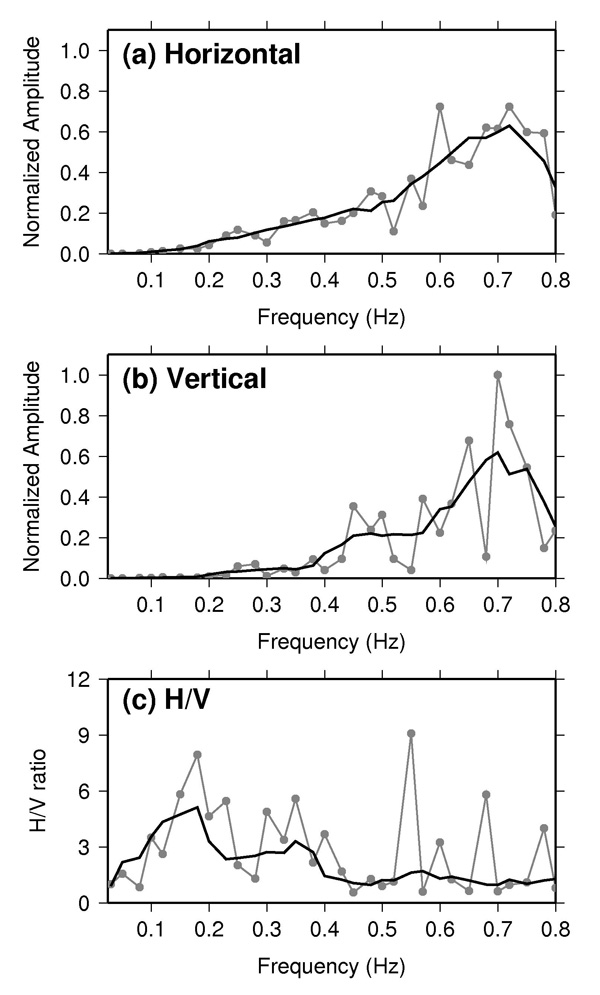
Horizontal amplitudes from synthetic waveforms convolved with various frequency sine waves at station 147 (gray line with solid circle). Black line shows a 5 points moving average. (b) Same as (a) for vertical component. For presentation purpose, curves in (a) and (b) are normalized by maximum amplitude. (c) The H/V spectral ratio obtained from (a) and (b). It is clear that moving average can effectively reduce the abnormal peak around 0.55 Hz.
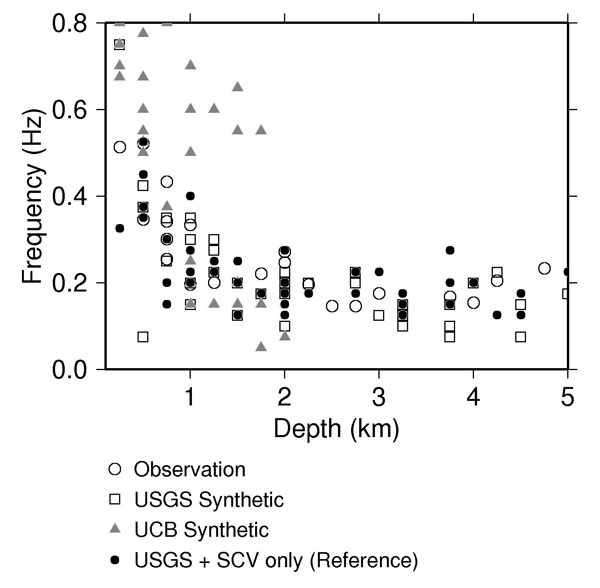
The frequencies of the dominant H/V spectral peaks (FDP) for observed and synthetic SCVSE data sets. Open circles show observed FDPs. Open square and gray triangles represent the simulated FDPs for USGS and UCB 3D velocity models, respectively. Solid circles are the same as open squares but 1D velocity models is assumed for the region outside of the basin.
References
Junkee Rhie and Douglas Dreger, (2009), A simple method for simulating microseism H/V spectral ratio in 3D structure, Geosciences Journal, 13(4), 401-406. [PDF]